Get Progress Charts at Dashboard
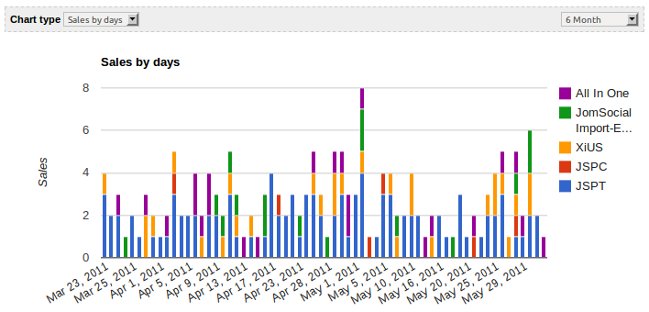
We just want you to have a glance on how these charts look? Here is an example: PayPlans chart of "Sales" of our JoomlaXi products.
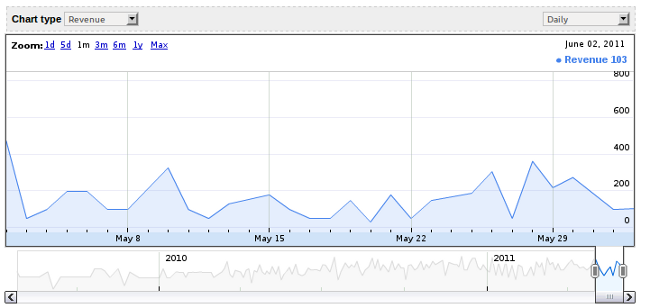
Now, look at "Revenue chart" with respect to time. You can even zoom it as per your requirement.
Benefits of PayPlans Charts:
- You have progress details in the form of charts whenever you visit PayPlans component. No need to break your head with complex data.
- No extra settings are required to generate charts and reportings.
- You have the flexibility to view specific part of chart for more clearance.
- You don't have to take pain of moving anywhere else than your back-end to just watch your sales and revenue.
- Display of charts at your choice:
- You can create any number of instances of PayPlans Charts module to display it on another positions ( excluding PayPlans positions also).
- Multiple charts can be made to display together at the same time through cloning.
Charts and reporting feature will be available very soon with PayPlans 1.2. So Keep your eyes on 1.2 release and acknowledge us with your feedbacks and ideas about charts.

Shyam Verma
Full Stack Developer & Founder
Shyam Verma is a seasoned full stack developer and the founder of Ready Bytes Software Labs. With over 13 years of experience in software development, he specializes in building scalable web applications using modern technologies like React, Next.js, Node.js, and cloud platforms. His passion for technology extends beyond coding—he's committed to sharing knowledge through blog posts, mentoring junior developers, and contributing to open-source projects.